November 27, 2012, 8:02 am -- /EPR NETWORK/ -- Pricing Nation Econometrics forecasts that the average home value in the Boston Metropolitan Statistical Area (MSA) will increase by 1.97 percent over the next twelve months. A table with the top 10 biggest increases and decreases per zip code can be found below. With housing prices still declining in many parts of the country, Boston Area homeowners should be pleased that their home prices will continue to increase in 2013. The Pricing Nation Econometrics Heat Map (also below) visualizes how the average home prices will vary across zip codes in the Boston MSA. Pricing Nation Econometrics is a division of Pricing Nation LLC, and more information can be found at www.pricingnation.com.
For more information on future changes in individual home values visit us at www.pricingnation.com.
About Pricing Nation
The purchase of a home is historically the largest investment one will make in one's life. However, due to recent volatility from the Credit and Housing Crisis, home values are not always likely to increase. To ensure that buyers and sellers are confident in their investment decisions, Pricing Nation has developed a portfolio of regression based models that forecast housing price changes at the MSA, zip, and house level. These models are highly statistically significant as they were built using local housing demand/supply and macroeconomic datafrom the last ten years, which saw extreme upward and downward movements. Of particular note is that Pricing Nation's forecasting model would have anticipated the severe downturn in Boston MSA home values in August 2006, a full twelve months before the actual downturn hit in August 2007, and 16 months before the U.S. officially entered a recession.*
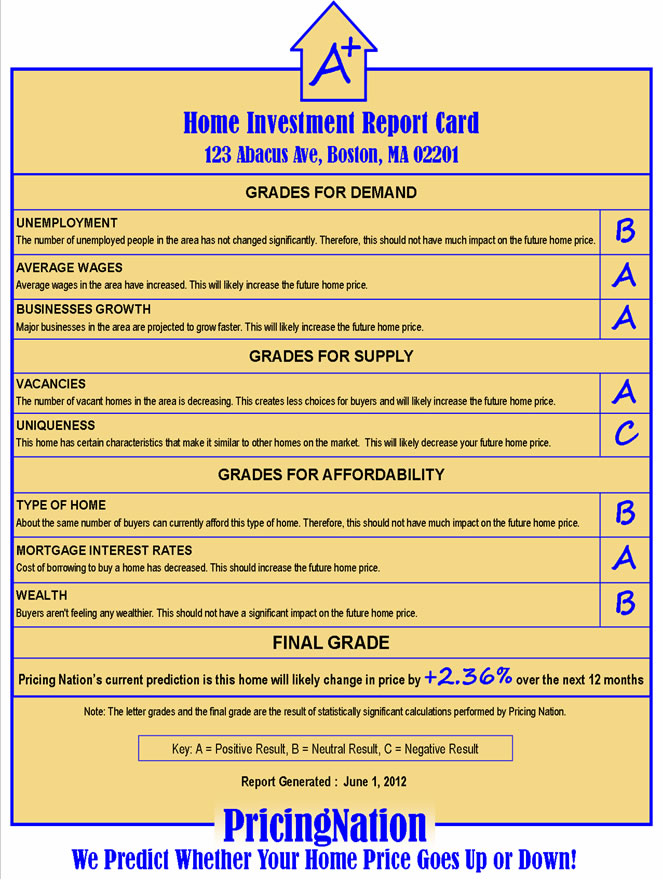
Pricing Nation is offeringitsindividualhome value forecast reports for an introductory price of $19.99 per home (regular price $49.99 per home). Our The Home Investment Report Card, displays the actual prediction for the future change in value for your selected hometaking into account the unique characteristics of each home and the surrounding area. In addition, it also providesgradesfor the local and national factors impacting home value, and outlines the significance ofeach factor toward future changes. The Home Investment Report card is designed to be easy to use for all homebuyers and sellers as they make one of the biggest decisions of their lives.
Pricing Nation has initially launched its product in the Boston MSA and is expanding its offerings to other cities in the near future.
For more information, please contact Raj Koganti at raj@pricingnation.com
Downturn data reported by S&P/Case-Shiller Home Price Indices, and recession data reported by the National Bureau of Economic Research (NBER)
Cities/Towns with Highest Increase in Home Values |
||
| City/Town Name | Zip Code | % Change |
| New Durham, NH | 03855 |
12.70 |
| Sandown, NH | 03873 |
12.57 |
| Lawrence, MA | 01840 |
12.50 |
| Rochester, NH | 03839 |
12.40 |
| Barrington, NH | 03825 |
11.89 |
| East Rochester, NH | 03868 |
10.68 |
| Holliston, MA | 01746 |
10.22 |
| Chester, NH | 03036 |
9.90 |
| Newfields, NH | 03856 |
9.88 |
| Stow, MA | 01775 |
9.53 |
Cities/Towns with Highest Decrease in Home Values |
||
| City/Town Name | Zip Code | % Change |
| Center Barnstead, NH | 03225 |
-11.67 |
| Devens, MA | 01434 |
-10.50 |
| Somersworth, NH | 03878 |
-9.72 |
| Plymouth, MA | 02360 |
-9.18 |
| Wareham, MA | 02571 |
-9.12 |
| Plaistow, NH | 03865 |
-9.00 |
| Boston, MA | 02115 |
-8.86 |
| Boston, MA | 02111 |
-8.75 |
| Hingham, MA | 02043 |
-8.26 |
| Hopkington, MA | 01748 |
-8.24 |
MEDIA: